这里由于还没有搞清楚具体的实施方案所以后五次作业还未上传。
第一次作业
第一题
help(stem)## starting httpd help server ... donedata5<-c(12, 12, 11, 10, 9, 10, 12)
stem(data5)##
## The decimal point is at the |
##
## 9 | 0
## 10 | 00
## 11 | 0
## 12 | 000第二题
x <- ((0:10000)/10000)*2*pi
y <- x^3 + sin(x)*cos(x)
plot(x, y, col="blue", type="l", xlab="自变量X", ylab="函数Y", main="示意图")
第二次作业
第一题
1.随机变量\(X~B(10,0.4)\),求分布律和分布函数,求\(P(X=3)\) 解:
x<-0:20
(y<-dbinom(x,10,0.4))#分布律
## [1] 0.0060466176 0.0403107840 0.1209323520 0.2149908480 0.2508226560
## [6] 0.2006581248 0.1114767360 0.0424673280 0.0106168320 0.0015728640
## [11] 0.0001048576 0.0000000000 0.0000000000 0.0000000000 0.0000000000
## [16] 0.0000000000 0.0000000000 0.0000000000 0.0000000000 0.0000000000
## [21] 0.0000000000(pbinom(x,10,0.4))#分布函数## [1] 0.006046618 0.046357402 0.167289754 0.382280602 0.633103258 0.833761382
## [7] 0.945238118 0.987705446 0.998322278 0.999895142 1.000000000 1.000000000
## [13] 1.000000000 1.000000000 1.000000000 1.000000000 1.000000000 1.000000000
## [19] 1.000000000 1.000000000 1.000000000求\(P(X=3)\)
(pbinom(3,10,0.4))## [1] 0.3822806第二题
随机变量\(X\)服从1到5的离散均匀分布,求\(P(1<X<3)\)
(punif(3,1,5)-punif(1,1,5))## [1] 0.5第三题
随机变量\(X~U(2,4)\),画出密度函数和分布函数,求\(P(2.5<X<3.5)\)
x<-seq(0,8,0.01)
y<-dunif(x,2,4)
z<-punif(x,2,4)
data1<-data.frame(a=x,b=y,c=z)
#g<-ggplot(data = data1,aes(x=a,y=b),col="red")+geom_line()
library(ggplot2)
ggplot()+geom_line(data=data1,aes(x=a,y=c),col="blue")+geom_line(data = data1,aes(x=a,y=b),col="red")
(punif(3.5,2,4)-punif(2.5,2,4))## [1] 0.5第四题
随机变量\(X~E(4)\)画出密度函数和分布函数,求\(P(1<X<5)\)
x<-seq(0,5,0.5)
y<-dexp(x,4)
z<-pexp(x,4)
plot(x,z,type = "l",col="blue")
lines(x,y,type ="l",col="red")
(pexp(5,4)-pexp(1,4))## [1] 0.01831564第五题
x<-seq(-5,5,0.01)
y<-dnorm(x,1,2)
z<-pnorm(x,1,2)
plot(x,y,type = "l",col="red")
lines(x,z,type="l",col="blue")
(pnorm(3,1,2)-pnorm(-2,1,2))## [1] 0.7745375第三次作业
第一题
#help(tapply)
data7<-data.frame(name = c("jack","rose","mike"),age = c(5,6,7),score = c(60,80,90))
aver<-tapply(data7$score,data7$age,mean)
aver
## 5 6 7
## 60 80 90第二题
data8<-read.table(file= "D:/rclasstongjiruanjian/user.txt",header = T)table(data8[,2])##
## F M
## 9 10table(data8[,3])##
## 11 12 13 14 15 16
## 2 5 3 4 4 1d<-tapply(data8[,4],data8[,2],mean)
d## F M
## 60.58889 63.91000e<-tapply(data8[,4],data8[,3],mean)
e## 11 12 13 14 15 16
## 54.40000 59.44000 61.43333 64.90000 65.62500 72.00000list<-list(sexcount=table(data8[,2]),agecount = table(data8[,3]),sexheight = d,ageheight = e)
list## $sexcount
##
##  F  M
##  9 10
##
## $agecount
##
## 11 12 13 14 15 16
##  2  5  3  4  4  1
##
## $sexheight
##        F        M
## 60.58889 63.91000
##
## $ageheight
##       11       12       13       14       15       16
## 54.40000 59.44000 61.43333 64.90000 65.62500 72.00000第三题
q<-rnorm(100,0,1)
juzhen<-matrix(q,5,20)
juzhen
## [,1] [,2] [,3] [,4] [,5] [,6]
## [1,] 1.5986562 0.30706179 -0.1007051 0.8483531 0.06638324 -0.5298676
## [2,] -0.3581486 1.97126697 0.4216181 1.4305401 -1.52644143 -2.2966440
## [3,] -1.5189005 -0.23914437 -0.5018847 0.3364413 1.43585825 0.1200956
## [4,] 2.5078224 -0.04351416 -0.2460952 -0.7944763 0.50331543 -0.4103107
## [5,] -1.2820549 -1.91739324 -1.7046170 -1.7517257 0.62260580 -0.5075274
## [,7] [,8] [,9] [,10] [,11] [,12]
## [1,] -0.74443046 0.9086036 -0.37306092 1.7876926 0.9790418 0.7291389
## [2,] 0.33059016 -0.5551763 0.88875684 0.8272038 1.2917029 -0.7235849
## [3,] -1.42660959 2.4850482 0.11616118 0.8672004 -0.0896518 0.1030129
## [4,] 0.08865374 0.7419789 2.53191605 0.1761840 -0.5018744 -0.1971965
## [5,] 0.94713663 0.6526863 -0.08804171 -0.6228922 2.0188305 0.5249277
## [,13] [,14] [,15] [,16] [,17] [,18]
## [1,] -1.2371429 1.09028585 -1.34780318 -1.1959029 -0.6514890 0.7002292
## [2,] -1.7600375 0.02826079 -0.04768925 0.7244111 0.2583115 0.9247852
## [3,] 0.9720902 -1.40024185 -1.25591583 -0.7060724 0.2741938 -0.6491607
## [4,] 0.1911341 0.50819406 -0.88966257 -1.4753059 -1.4796076 0.2709893
## [5,] 0.0694099 0.46707881 -0.16562858 -0.4809066 0.7544185 -1.5929476
## [,19] [,20]
## [1,] -0.4807801 -1.7424240
## [2,] -0.8642800 0.6011741
## [3,] 0.4939659 -1.1315631
## [4,] -0.8525664 1.8595967
## [5,] 1.3993939 -0.8192179write.table(as.vector(juzhen),file="juzhen.txt")
w<-read.table("juzhen.txt")
y<-matrix(t(w),5,20)第四题
t<-0
for( i in 1:100)
    t<-(t+1/i)
    print(t)
## [1] 5.187378第四次作业
课后第一题
findmax <- function(x){
  p<-which(x==x[which.max(x)],arr.ind = T)
  list(maxvalue = x[p],location=which(x==x[which.max(x)],arr.ind = T))
}
A = matrix(floor(rnorm(100,0,4)),4,25)
findmax(A)
## $maxvalue
## [1] 8 8 8
##
## $location
## row col
## [1,] 4 7
## [2,] 1 9
## [3,] 2 19作业第二题
test<-function(x,y){
  p<-(x^2+sin(x*y)+2*y)
  return(p)
}
第三节课第三题
fillna<-function(a){
  m<-which(is.na(a),arr.ind = T)
  a[m]<-c(rep(mean(a,na.rm =TRUE),nrow(m)))
  return(a)

}
A=matrix(floor(rnorm(100,0,4)),4,25)
A[2,5]=NA; A[4,8]=NA; A[3,15]=NA
fillna(A)
## [,1] [,2] [,3] [,4] [,5] [,6] [,7] [,8] [,9] [,10] [,11]
## [1,] 4 2 5 -6 4.00000000 -2 -1 0.00000000 3 8 -2
## [2,] -4 0 3 -3 0.01030928 3 3 -6.00000000 -9 -2 -4
## [3,] -3 3 6 -1 0.00000000 6 -3 -2.00000000 3 1 5
## [4,] -1 -3 1 -2 -6.00000000 -2 -6 0.01030928 9 -3 5
## [,12] [,13] [,14] [,15] [,16] [,17] [,18] [,19] [,20] [,21] [,22]
## [1,] -4 -6 -5 -1.00000000 1 3 -4 2 -6 9 6
## [2,] -5 2 5 -3.00000000 -3 5 -1 3 -2 3 -1
## [3,] 6 1 0 0.01030928 -4 1 -14 4 1 3 -3
## [4,] -1 5 -6 0.00000000 -4 6 -3 1 -3 0 -3
## [,23] [,24] [,25]
## [1,] 5 4 -2
## [2,] -1 -5 4
## [3,] 3 -1 0
## [4,] 1 1 4第三节课第四题
fzero<-function(f, a, b, eps=1e-5){
  if   (f(a)*f(b)>0)
    list (fail="finding root is fail!")
  else {repeat {
    if (abs(b-a)<eps)   break
    x<-(a+b)/2
    if  (f(a)*f(b)<0)  b<-x else a<-x
  }
    list(root=(a+b)/2, fun=f(x))
  }
}
f<-function(x) {x^3-x-1}
fzero(f,1,2,1e-5)
## $root
## [1] 1.249996
##
## $fun
## [1] -0.2969031第五次作业
data <- read.table("cl.txt", header=TRUE)
names(data) <- c("name", "age", "height", "weight", "sex")
plot(data$height, data$weight, main="Regression on Height and Weight",
xlab="Height", ylab="Weight") 
par(mfrow=c(2, 2))
qqnorm(data$weight)
hist(data$weight)
boxplot(data$weight)
qqplot(data$height, data$weight, main="QQPLOT", xlab="Height", ylab="Weight")
第二题
data <- read.table("cl.txt", header=TRUE)
plot(data)
#coplot(data$Weight~data$Height|data$sex)
pairs(data[,c("Age", "Weight", "Height")])
x <- data.frame(x1=rnorm(72, 0, 1),
             x2=rnorm(72, 0, 1),
             x3=rnorm(72, 0, 1),
             x4=rnorm(72, 0, 1))
t <- ts(x, start=c(2015, 1), frequency=12)
plot(t)
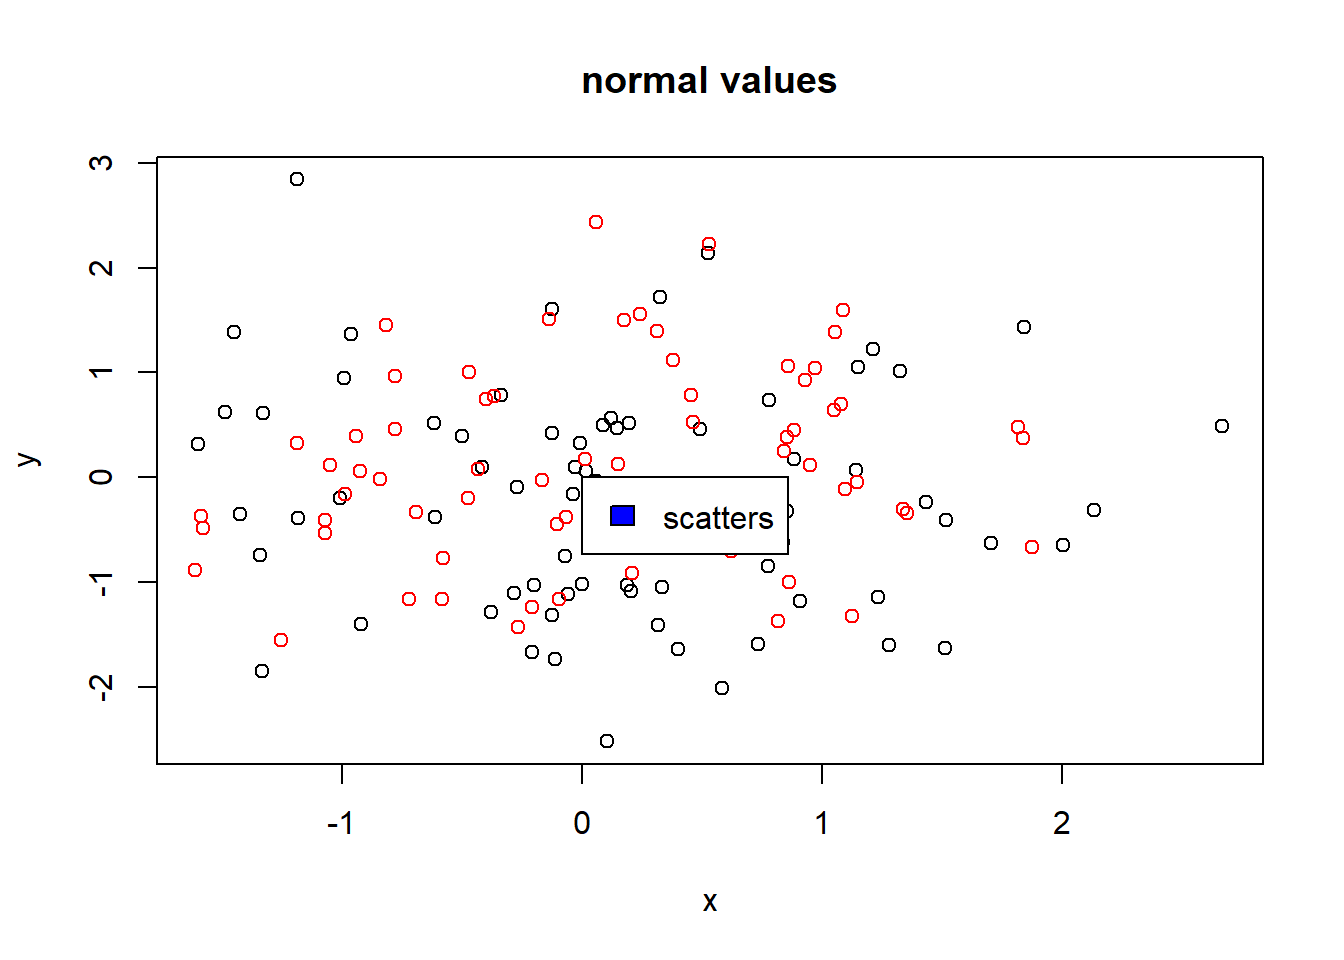
plot(x[,"x1"], x[,"x2"], col="black", xlab="x", ylab="y", main="normal values")
points(x[,"x3"], x[,"x4"], col="red")
legend(0, 0, "scatters", fill="blue")
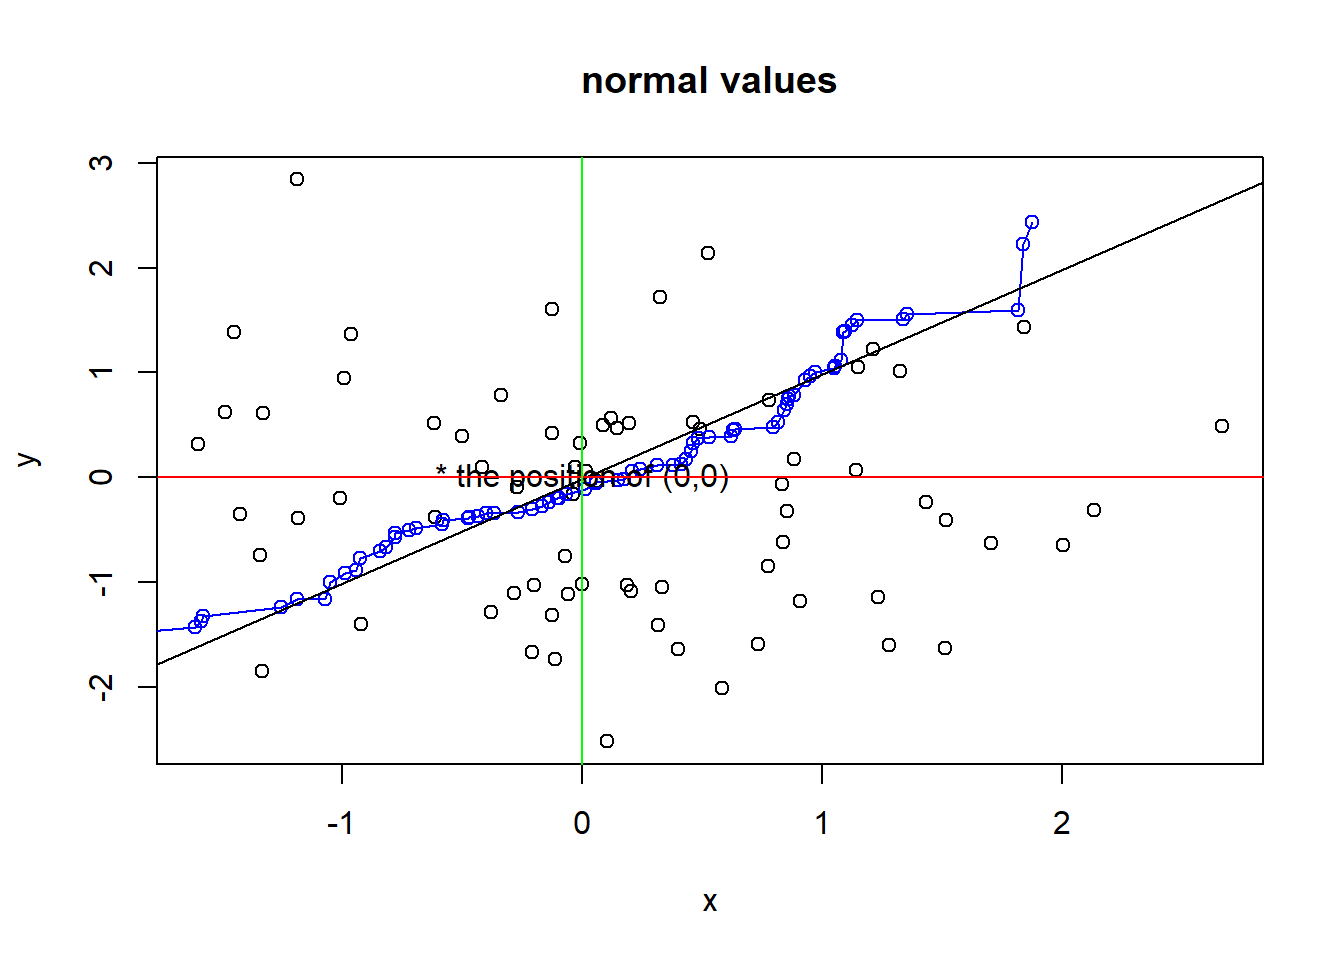
plot(x[,"x1"], x[,"x2"], col="black", xlab="x", ylab="y", main="normal values")
lines(sort(x[,"x3"], decreasing=T), sort(x[,"x4"], decreasing=T), col="blue",type="o")
text(0, 0, labels="* the position of (0,0)")

l <- lm(sort(x[,"x3"], decreasing=T)~sort(x[,"x4"], decreasing=T))
abline(l$coefficients)
abline(h=0,col="red")
abline(v=0,col="green")
第三题
将屏幕分为四块并分别画出
y=sin(x)
z=3*cos(x)
a=sin(x)*cos(x)
b=sin(x)/x
par(mfrow=c(2,2))
x <- ((0:1000)/1000)*4*pi
plot(x, sin(x), col="red")
plot(x, 3*cos(x), col="blue")
plot(x, sin(x)*cos(x), col="yellow")
plot(x, sin(x)/x, col="green")
第六次作业
第六次作业
公司雇员数据分析
本次作业搜集到了公司的雇员数据,通过对数据进行统计分析,通过探索性分析得到相关结果。
数据展示
首先对读入的数据进行大致分析。
library(tidyverse)## -- Attaching packages --------------------------------------- tidyverse 1.3.1 --## v tibble 3.1.2 v dplyr 1.0.6
## v tidyr 1.1.3 v stringr 1.4.0
## v readr 1.4.0 v forcats 0.5.1
## v purrr 0.3.4## -- Conflicts ------------------------------------------ tidyverse_conflicts() --
## x dplyr::filter() masks stats::filter()
## x dplyr::lag() masks stats::lag()data<-read.csv("Employee.csv",header = T)
rmarkdown::paged_table(data)从上表我们可以看出,该数据共有9个变量,其中分类变量有性别(男性或者女性),是否是少数人种(是或者否),连续型变量有工资薪水,起始工资等,变量种类挺多需要进一步分析。
可视化分析探索
首先进行因子化处理。
data$gender<-as.factor(data$gender)
data$minority<-as.factor(data$minority)
data$educ<-as.factor(data$educ)
data$jobcat<-as.factor(data$jobcat)
收入与性别分类箱线图
ggplot(data = data,aes(x=gender,y=salary))+geom_jitter(alpha=.35,color='#4169E1',size=2.2)+geom_boxplot(alpha=.7,color='#000080')+stat_summary(fun.y="mean",geom="point",color="#000080",shape=6,size=3.5)+theme(axis.title.y=element_text(size=15))+theme(axis.title.x=element_text(size=15))+theme(axis.text.y=element_text(size=15))+theme(axis.text.x=element_text(size=15))
从收入与性别分类箱线图可以看出,男性的收入整体显著比女性高。女性收入较为集中,男性收入的分散程度大于女性。
收入与是否少数族裔箱线图
ggplot(data = data,aes(x=minority,y=salary))+geom_jitter(alpha=.35,color='#4169E1',size=2.2)+geom_boxplot(alpha=.7,color='#000080')+stat_summary(fun.y="mean",geom="point",color="#000080",shape=6,size=3.5)+theme(axis.title.y=element_text(size=15))+theme(axis.title.x=element_text(size=15))+theme(axis.text.y=element_text(size=15))+theme(axis.text.x=element_text(size=15))## Warning: `fun.y` is deprecated. Use `fun` instead.
从收入与是否少数族裔图看出,非少数族裔的收入中位数与少数族裔的中位数的显著差别不大,但是非少数族裔的收入整体还是明显大于少数族裔的收入,说明在美国,少数族裔的收入是明显低于非少数族裔的。
收入与教育年限分类箱线图
ggplot(data = data,aes(x=educ,y=salary))+geom_jitter(alpha=.35,color='#4169E1',size=2.2)+geom_boxplot(alpha=.7,color='#000080')+stat_summary(fun.y="mean",geom="point",color="#000080",shape=6,size=3.5)+theme(axis.title.y=element_text(size=15))+theme(axis.title.x=element_text(size=15))+theme(axis.text.y=element_text(size=15))+theme(axis.text.x=element_text(size=15))
通过上图可以看出,受教育年限是明显的与收入大小成正比关系。在8和12这两个阶段相差不大,但是在16和17这两个阶段相差很大,一旦受教育程度从16提升到17,其收入程度会有很大的提升。并且随着年度的增加,这种边际效益会慢慢递减。
收入与职位等级分类箱线图
ggplot(data = data,aes(x=jobcat,y=salary))+geom_jitter(alpha=.35,color='#4169E1',size=2.2)+geom_boxplot(alpha=.7,color='#000080')+stat_summary(fun.y="mean",geom="point",color="#000080",shape=6,size=3.5)+theme(axis.title.y=element_text(size=15))+theme(axis.title.x=element_text(size=15))+theme(axis.text.y=element_text(size=15))+theme(axis.text.x=element_text(size=15))## Warning: `fun.y` is deprecated. Use `fun` instead.
通过上图看出,职位等级的不同会明显提升收入水平,而在第二等级的数据十分紧密,初步推测是由于样本太小导致的,对数据中的jobcat进行计数分析如下。
knitr::kable(data%>%count(jobcat))| jobcat | n |
|---|---|
| 1 | 363 |
| 2 | 27 |
| 3 | 84 |
从上图看出,位于第二等级的样本明显小于其他两个等级,所以导致箱线图过于紧密。
受教育年限与性别关系
data2<-read.csv("Employee.csv",header = T)#读取没有因子化的数据
ggplot(data2,aes(x=educ,fill=gender))+geom_histogram(position = "identity",alpha=0.6,bins = 25)+theme(axis.title.y=element_text(size=15))+theme(axis.title.x=element_text(size=15))+theme(axis.text.y=element_text(size=15))+theme(axis.text.x=element_text(size=15))
从上图看出,在搜集到的数据中,男性的受教育程度明显的多于女性,这也与受教育程度越高收入越高的事实相对应。
工作时间与性别关系图
ggplot(data2,aes(x=jobtime,fill=gender))+geom_histogram(position = "identity",alpha=0.6,bins = 25)+theme(axis.title.y=element_text(size=15))+theme(axis.title.x=element_text(size=15))+theme(axis.text.y=element_text(size=15))+theme(axis.text.x=element_text(size=15))
从上图可以看出女性的工作市场在85一周之前是相对比男性多,但是在每周85之后是明显的少于男性工作时长。这也许是因为男性从事的工作的时间长度明显大于女性。
不同起始薪资与收入的关系
ggplot(data = data2,aes(x = salbegin))+geom_histogram(binwidth = 500,color = "blue")+geom_freqpoly(mapping = aes(x=salary),binwidth = 500,color = "red")
上图纵轴是计数,横轴是起始薪资和当前薪资。直方图代表起始薪资,折线图代表现在的薪资。从上图看出,基本上当前的薪资都会比起始薪资高,并且数据都是在峰值左边较为聚集,在峰值右边明显的分散。
薪资数据建模分析。
通过之前的描述分析我们大致对数据有了初步的认识和判断,接着对数据进行建模分析。在这个问题中,薪资为因变量,自变量中含有因子类型的数据。首先使用传统的线性回归建立模型
options(scipen = 200)
data3<-read.csv("Employee.csv",header = T)
data3$gender<-as.factor(data3$gender)#将性别转化为因子型
data3$minority<-as.factor(data3$minority)#将少数民族转化为因子型
model1<-lm(salary~educ+jobcat+salbegin+jobtime+prevexp+minority+gender,data=data3)
summary(model1)
##
## Call:
## lm(formula = salary ~ educ + jobcat + salbegin + jobtime + prevexp +
## minority + gender, data = data3)
##
## Residuals:
## Min 1Q Median 3Q Max
## -22901 -3159 -744 2621 46291
##
## Coefficients:
## Estimate Std. Error t value Pr(>|t|)
## (Intercept) -13610.92441 3007.16431 -4.526 0.000007634730 ***
## educ 470.05170 153.56653 3.061 0.00233 **
## jobcat 5760.34182 621.45145 9.269 < 0.0000000000000002 ***
## salbegin 1.31956 0.07011 18.821 < 0.0000000000000002 ***
## jobtime 149.98267 31.32723 4.788 0.000002270406 ***
## prevexp -20.94984 3.32098 -6.308 0.000000000656 ***
## minority1 -987.39645 784.18450 -1.259 0.20861
## genderm 2139.92620 735.59361 2.909 0.00380 **
## ---
## Signif. codes: 0 '***' 0.001 '**' 0.01 '*' 0.05 '.' 0.1 ' ' 1
##
## Residual standard error: 6805 on 466 degrees of freedom
## Multiple R-squared: 0.8435, Adjusted R-squared: 0.8412
## F-statistic: 358.9 on 7 and 466 DF, p-value: < 0.00000000000000022将薪资作为自变量,受教育年限,职位等级,起始薪资,工作经验,工作时长,性别,作为因变量,建模线性回归模型。最终的模型为\(y=-13610.92+470.05*educ+5760*jobcat+1.31*salbegin+149.98*jobtime-20.94*prevexp-987.39*minority+2139.92*gender\)。 但是发现模型的minority变量没有通过检验,不显著,因此考虑剔除该变量。
模型的检验
par(mfrow=c(2,2))
plot(model1,which = c(1:4))
library(equatiomatic)加权最小二乘建模
通过上面四张图看出该模型有一定的异方差性,需要进行加权建模。这里我们将权重设置为,salbegin,jobcat和jobtime三个变量的平方分之一,接着对模型进行分析。
model2<-lm(salary~educ+jobcat+salbegin+jobtime+prevexp+gender,data=data3)
resd<-model2$residuals
resd<-abs(resd)
summary(model2)
##
## Call:
## lm(formula = salary ~ educ + jobcat + salbegin + jobtime + prevexp +
## gender, data = data3)
##
## Residuals:
## Min 1Q Median 3Q Max
## -22924 -3272 -670 2606 46565
##
## Coefficients:
## Estimate Std. Error t value Pr(>|t|)
## (Intercept) -13822.1833 3004.3615 -4.601 0.000005431508 ***
## educ 471.8788 153.6559 3.071 0.00226 **
## jobcat 5802.3314 620.9449 9.344 < 0.0000000000000002 ***
## salbegin 1.3284 0.0698 19.030 < 0.0000000000000002 ***
## jobtime 148.5239 31.3254 4.741 0.000002824209 ***
## prevexp -21.4462 3.2996 -6.500 0.000000000207 ***
## genderm 2005.0468 728.2081 2.753 0.00613 **
## ---
## Signif. codes: 0 '***' 0.001 '**' 0.01 '*' 0.05 '.' 0.1 ' ' 1
##
## Residual standard error: 6809 on 467 degrees of freedom
## Multiple R-squared: 0.843, Adjusted R-squared: 0.841
## F-statistic: 417.9 on 6 and 467 DF, p-value: < 0.00000000000000022model3<-lm(salary~educ+jobcat+salbegin+jobtime+prevexp+gender,data=data3,weights = salbegin^{-2}+jobcat^{-2}+jobtime^{-2})
summary(model3)##
## Call:
## lm(formula = salary ~ educ + jobcat + salbegin + jobtime + prevexp +
## gender, data = data3, weights = salbegin^{
## -2
## } + jobcat^{
## -2
## } + jobtime^{
## -2
## })
##
## Weighted Residuals:
## Min 1Q Median 3Q Max
## -14296 -2708 -642 2020 46853
##
## Coefficients:
## Estimate Std. Error t value Pr(>|t|)
## (Intercept) -12406.52132 2399.42065 -5.171 0.000000346681527 ***
## educ 446.91621 121.49125 3.679 0.000262 ***
## jobcat 5055.52805 886.57803 5.702 0.000000020991222 ***
## salbegin 1.45811 0.08887 16.407 < 0.0000000000000002 ***
## jobtime 121.53179 23.96567 5.071 0.000000571490307 ***
## prevexp -18.95859 2.54655 -7.445 0.000000000000472 ***
## genderm 1511.88296 553.91437 2.729 0.006584 **
## ---
## Signif. codes: 0 '***' 0.001 '**' 0.01 '*' 0.05 '.' 0.1 ' ' 1
##
## Residual standard error: 4656 on 467 degrees of freedom
## Multiple R-squared: 0.717, Adjusted R-squared: 0.7134
## F-statistic: 197.2 on 6 and 467 DF, p-value: < 0.00000000000000022#计算model3残差
e<-resid(model3)
abse<-abs(e)
y.fit<-predict(model3)
biaozhunhua<-scale(e)
sqrtcancha<-sqrt(biaozhunhua)## Warning in sqrt(biaozhunhua): 产生了NaNsplot(sqrtcancha~y.fit)
模型的表达式如下 \[ \operatorname{salary} = \alpha + \beta_{1}(\operatorname{educ}) + \beta_{2}(\operatorname{jobcat}) + \beta_{3}(\operatorname{salbegin}) + \beta_{4}(\operatorname{jobtime}) + \beta_{5}(\operatorname{prevexp}) + \beta_{6}(\operatorname{gender}_{\operatorname{m}}) + \epsilon \]
进行加权和未进行加权比较
未进行加权建模图
(
par(mfrow=c(2,2))
plot(model2,which = c(1:4),caption = "model2未加权")
)
)
进行加权建模图
(
par(mfrow=c(2,2))
plot(model3,which = c(1:4),caption = "model3加权建模")
)
)
通过上图看出,通过加权可以解决模型的异方差性。
检验多重共线性
library(car)## 载入需要的程辑包:carData##
## 载入程辑包:'car'## The following object is masked from 'package:dplyr':
##
## recode## The following object is masked from 'package:purrr':
##
## someround(vif(model3),2)## educ jobcat salbegin jobtime prevexp gender
## 1.53 1.54 2.32 1.02 1.11 1.33上述变量都小于10并且接近1,说明没有多重共线性问题。
变量选择
在这里其实我感觉是不需要再进行变量选择的,因为模型已经解决了异方差性和多重共线性问题。但是课件上面讲了这些,还是做一下。
modelstep<-step(model3,direction = "both")#使用逐步回归法## Start: AIC=8013.64
## salary ~ educ + jobcat + salbegin + jobtime + prevexp + gender
##
## Df Sum of Sq RSS AIC
## <none> 10123086798 8013.6
## - gender 1 161490564 10284577362 8019.1
## - educ 1 293331236 10416418034 8025.2
## - jobtime 1 557438393 10680525190 8037.0
## - jobcat 1 704847552 10827934349 8043.5
## - prevexp 1 1201449131 11324535929 8064.8
## - salbegin 1 5835365806 15958452603 8227.4summary(modelstep)##
## Call:
## lm(formula = salary ~ educ + jobcat + salbegin + jobtime + prevexp +
## gender, data = data3, weights = salbegin^{
## -2
## } + jobcat^{
## -2
## } + jobtime^{
## -2
## })
##
## Weighted Residuals:
## Min 1Q Median 3Q Max
## -14296 -2708 -642 2020 46853
##
## Coefficients:
## Estimate Std. Error t value Pr(>|t|)
## (Intercept) -12406.52132 2399.42065 -5.171 0.000000346681527 ***
## educ 446.91621 121.49125 3.679 0.000262 ***
## jobcat 5055.52805 886.57803 5.702 0.000000020991222 ***
## salbegin 1.45811 0.08887 16.407 < 0.0000000000000002 ***
## jobtime 121.53179 23.96567 5.071 0.000000571490307 ***
## prevexp -18.95859 2.54655 -7.445 0.000000000000472 ***
## genderm 1511.88296 553.91437 2.729 0.006584 **
## ---
## Signif. codes: 0 '***' 0.001 '**' 0.01 '*' 0.05 '.' 0.1 ' ' 1
##
## Residual standard error: 4656 on 467 degrees of freedom
## Multiple R-squared: 0.717, Adjusted R-squared: 0.7134
## F-statistic: 197.2 on 6 and 467 DF, p-value: < 0.00000000000000022上面是使用逐步回归法模型。其实可以使用这个来消除多重共线性等问题。
总结
通过各种方法,解决了异方差性和多重共线性,本文最终建立的模型如下: \[ salary=-12406.52+446.91*educ+5055.52*jobcat+1.45*salbegin+121.53*jobtime-18.95*prevexp+1511.88*gender \]